How to Use DexScreener: A Beginner's Reading Guide
DexScreener explained for beginners: read every metric in plain words, spot misleading numbers, and fill the gaps the chart cannot show you.

What is DexScreener?
DexScreener is a free, real-time screener that tracks trading pairs on decentralized exchanges across dozens of blockchains, showing each token's price, chart, liquidity, trading volume and market data on a single page. A trading pair is simply two assets that can be swapped for each other, like a new token and SOL.
Open any crypto group chat and a DexScreener link shows up within minutes. The site has become the default way to look at a token: one page, one chart, a wall of numbers. For a beginner, that wall is the problem. Price, liquidity, volume, FDV, transaction counts, the age of the market. Each field means something specific, and misreading one of them costs real money. Learning how to use DexScreener well starts with reading those fields correctly.
This guide walks through how to read DexScreener the way experienced traders do: what each number means in plain words, which two metrics matter most, which figures can mislead you, and what the screener cannot show by design. One thing before we start: this is not investment advice, just a reading lesson.
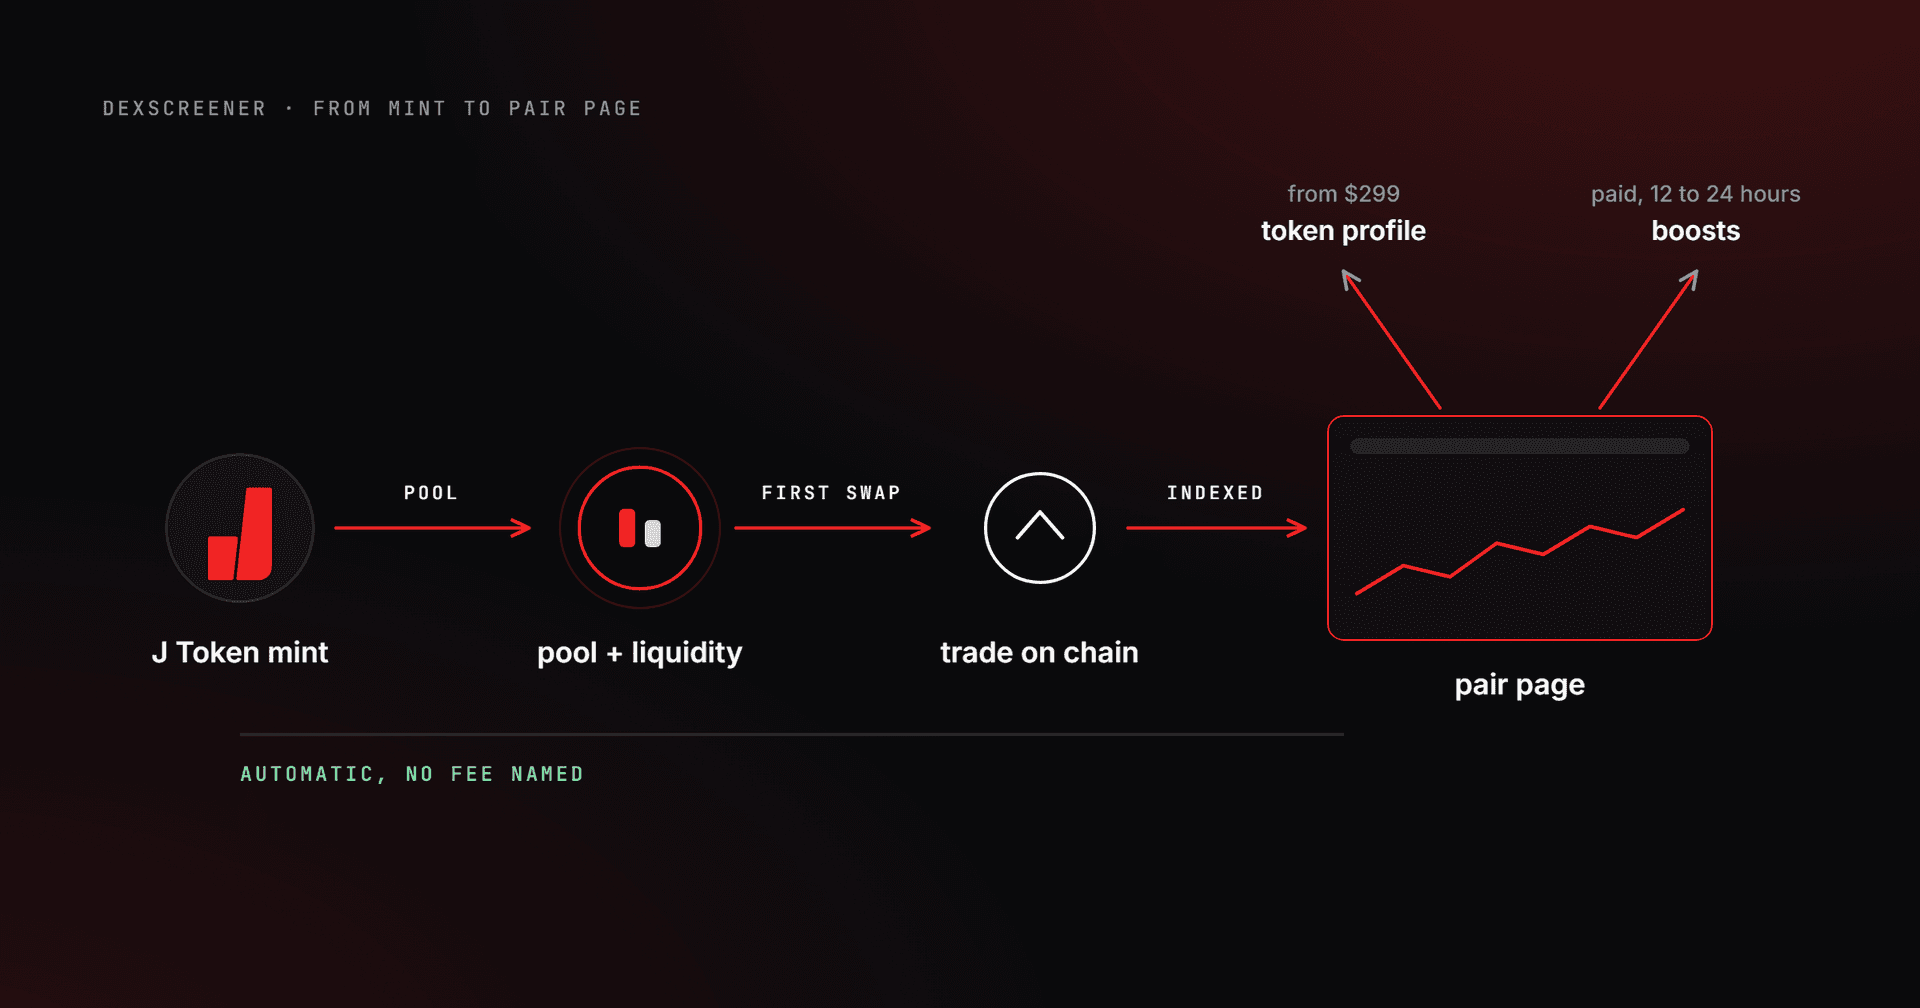
The data comes straight from the blockchains themselves. When someone creates a trading pool for a new token, the pair appears on DexScreener automatically, usually within seconds. No account is needed, nothing has to be submitted, and there is no approval step. That openness is also the catch: appearing on DexScreener says nothing about whether a token is legitimate. The site reports the market. It does not vet it.
What data does DexScreener show?
A pair page shows seven core fields: price, liquidity, volume, FDV, market cap, transaction counts and pair age. Together they describe how big a token's market is, how active it is, and how long it has existed. Here is what each one means in plain words.
| Field | What it means |
|---|---|
| Price | What one token last sold for, updated in real time with every trade. |
| Liquidity | The money sitting in the trading pool. This is what lets people buy and sell without wrecking the price. |
| Volume | The total value traded over a period, usually the last 24 hours. It measures activity, not size. |
| FDV | Fully diluted valuation: the price multiplied by every token that will ever exist, including ones not released yet. |
| Market cap | The price multiplied by the tokens actually in circulation right now. |
| Transactions | How many buys and sells happened in the period, counted separately. Lots of tiny buys and almost no sells is a pattern worth noticing. |
| Pair age | How long ago the trading pool was created. For most new Solana tokens this reads in minutes and hours, not days. |
The FDV versus market cap difference in one sentence: market cap counts only the tokens already circulating, while FDV pretends every token that could ever exist is already out there.
How to use DexScreener to read liquidity and volume
Read them together. Liquidity tells you how much money you can move without destroying the price. Volume tells you how much money actually moved. A healthy market has both. A dangerous one usually has a strange ratio between them, and that ratio is readable in about ten seconds.
Start with liquidity. Thin liquidity means you can get in but not out. Buying a small amount of a token with a shallow pool is easy. Selling it back after the price rises is where people get trapped, because a sale that is large relative to the pool crashes the price before the order finishes. As a loose rule, the smaller the pool, the more violently the chart reacts to every trade. If you want the mechanics behind that, we broke down how liquidity actually works on Solana in a separate guide.
Then put volume next to it. High volume on decent liquidity is a real market. High volume on a tiny pool is a red flag, and the question to ask is simple: how many wallets is this volume coming from? A million dollars traded by two thousand wallets looks like genuine interest. The same million from a dozen wallets looks like a show staged for the chart. DexScreener's transaction counts help here. Compare the number of trades to the volume and you get a rough sense of how many actors are behind the activity.

What do you check first on a new token?
Check age, liquidity, volume sources and early buyers, in that order. The sequence matters because each step filters faster than the one after it. A pair that fails the first check does not deserve the next four minutes of your attention. Here is the order in practice.
- Pair age. A pool created twenty minutes ago carries a completely different risk than one that has traded for six months. Most scams die young, so age alone filters out a lot.
- Liquidity, and whether it is locked. Look at the pool size, then find out whether the creators locked it. Unlocked liquidity can be pulled at any moment, taking everyone's exit with it.
- Where the volume comes from. Big volume from a handful of wallets is staged activity. Compare transaction counts to volume and be suspicious of round, rhythmic trading.
- What early buyers are doing. If the first wallets in are already selling into every small rise, insiders are cashing out while the chart still looks fine.
This covers the market-data half of the job. For everything beyond the chart, meaning token permissions, ownership and supply tricks, we keep the broader safety checklist updated in a separate post. When a token passes these checks and you decide to trade, the token swap tool with a price impact line tells you what your order will do to that same pool before you sign.
Which numbers can mislead you?
The four that mislead beginners most are volume, market cap, FDV and holder count. None of them is fake by default. All four can be dressed up, and dressed-up numbers are the main way new traders get talked into a bad pool. Take them one at a time.
Volume can be manufactured. The technique is called wash trading: the same actor buys and sells their own token in a loop, so the pair looks busy while nothing real is happening. Market cap can sit on a thin pool.
A token can show a ten million dollar market cap while its pool holds forty thousand, which means almost nobody could actually sell at that valuation. FDV creates its own illusion, because a huge locked supply waiting to be released can make today's price mathematically impossible to hold. And holder count says nothing about spread: a thousand holders can still mean half the supply sits in five wallets.
Every number on the screen describes the past. None of them predicts what happens next.
What does DexScreener not show?
DexScreener does not show wallet-to-wallet relationships: who funded whom, which wallets move together, and how the supply is actually spread across connected owners. It shows the market's output brilliantly. It does not show the actors producing that output, and on Solana the actors are often the whole story.
That gap is a scope decision rather than a flaw, and DexScreener handles its chosen scope better than almost anyone. But it means a token can look healthy on every visible metric while fifteen wallets funded from the same source quietly hold most of the supply. The chart cannot reveal that, because the chart only records trades, never relationships.
This is exactly what on-chain analysis tools exist for. Our free Wallet Scope analysis tool maps how wallets connect: shared funding sources, transfer patterns, clusters that behave as one actor. And the Token Snapshot holder tool pulls a token's real holder spread, so you can see how concentrated the supply actually is instead of trusting a raw holder count. Be honest with yourself about what these show, though. They surface signals and patterns. They do not prove intent, and connected wallets sometimes have boring explanations.
Is DexScreener free, and what are the alternatives?
Yes, DexScreener is free. Charts, pair data, search and alerts cost nothing and need no account. Projects can pay for extra profile features and visibility on the platform, which is a normal way for a free product to earn money, but the market data itself is open to everyone.
Alternatives exist and they overlap heavily. Birdeye leans into Solana analytics and portfolio views. DEXTools has a long history on Ethereum and its own scoring system. Solscan is not a screener at all but a block explorer, useful when you want to inspect a specific transaction or wallet rather than a chart. Most Solana traders end up using DexScreener for the chart and a mix of the others for whatever it does not cover. There is no wrong choice here; they are different lenses on the same public data.
Frequently asked questions
Is DexScreener reliable?
The data is reliable because it is read directly from public blockchains, and anyone can verify it against a block explorer such as Solscan. What is not guaranteed is the tokens themselves. Listing is automatic, so scams appear next to legitimate projects with identical formatting. Trust the numbers, not the fact of being listed.
How do I find a specific token on DexScreener?
Search by name or ticker, then confirm you have the right one, because scammers clone popular names constantly. The safe method is pasting the token's contract address, the long unique string from the project's official site, into the search bar. An address matches exactly one token. A name can match hundreds.
Does it cost money to get listed on DexScreener?
No. Listing is organic and automatic: the moment a trading pool exists on a supported exchange, the pair shows up on its own. What projects can pay for is extra visibility, things like enhanced profiles and promoted placement. Paid visibility changes how a token is presented, never whether it appears.
Why does the chart move so fast on new tokens?
Because the pool behind it is small. In a shallow pool, even a few hundred dollars shifts the price by whole percentage points, so the chart jumps with every trade. Established tokens with deep liquidity absorb the same trades without visibly moving. Speed on the chart usually reflects thinness, not excitement.
Does DexScreener show rug pulls?
Not directly. There is no flag that says a token will be abandoned, because no data source can know that in advance. The warning signs are readable on the screen, though: a very young pair, unlocked liquidity, volume concentrated in a few wallets, and early buyers selling into every rise.
Where can I see a token's holder spread?
Holder spread lives on-chain, not on the chart. Block explorers list the top holders one by one, and dedicated tools go further by grouping them. Token Snapshot on j.tools pulls the full spread in one view, so you can see whether a thousand holders really means a thousand independent owners.